
NBA Model | Calculate Popular Betting Markets
Added 2023-11-24 15:00:10 +0000 UTCGŌĆÖday lads,
Attached to this post is a free spreadsheet which shows how to use the Excel LADZ NBA Model to pick up the probabilities and ŌĆśIntrinsic ValueŌĆÖ of three popular betting markets. Spoiler; they can all be found using the SUMPRODUCT function!
JOIN the best Excel Sports Modelling Community by becoming a member of the Excel LADZ Patreon! Receive access to every model (including the Excel LADZ 2023-24 NBA Model) as well as technical posts which will improve your understanding of sports modelling. You also have the ability to directly message me, so I can help you with any problems lads!
WeŌĆÖll use the example of the LA Clippers playing at the San Antonio Spurs. As of today (15 games into the season), the NBA Model returns a win probability for the Spurs and Clippers of 29% and 71% respectively. The expected is 105 - 116, in favour of the Clippers.

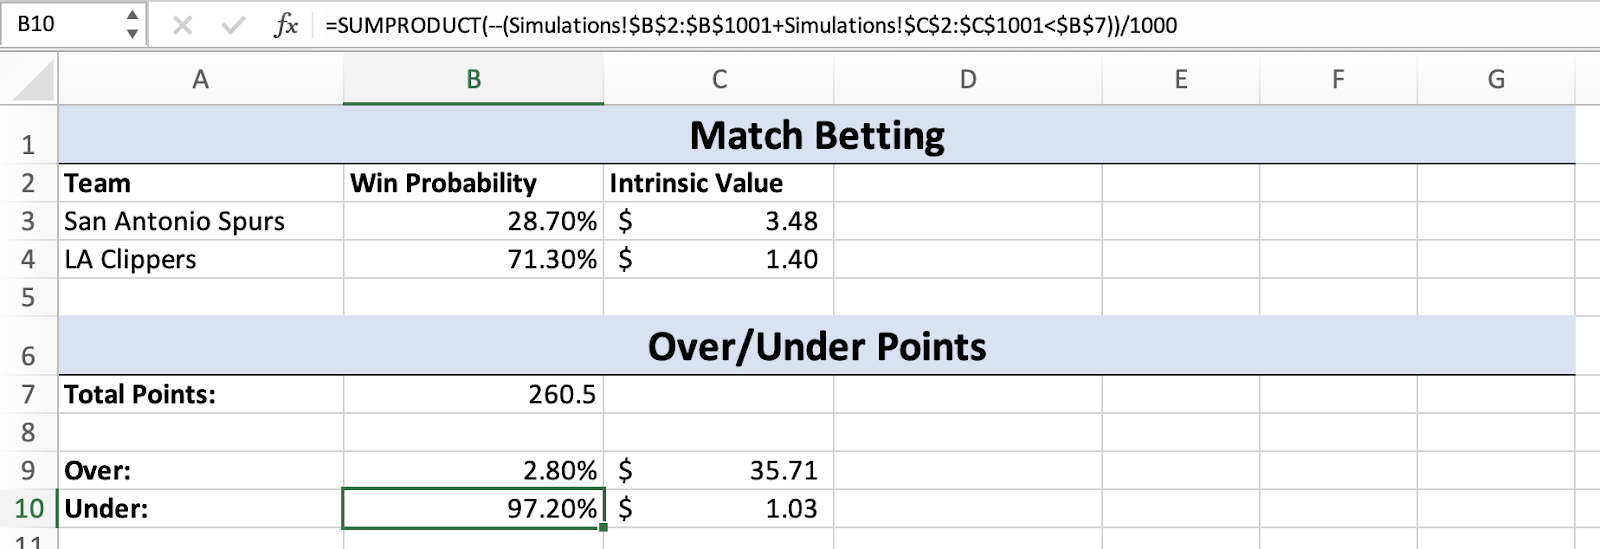
Match Betting
The match market is betting on who will win the match. To calculate fair odds for this, we need to come up with the Win Probability for each team (as seen above). Firstly, letŌĆÖs find the SpursŌĆÖ probability of winning the game.
In the ŌĆśSimulationsŌĆÖ worksheet, we have 1000 simulated scorelines. Using the SUMPRODUCT function, weŌĆÖre able to find the amount of times the Spurs beat the Clippers. Then, dividing by the amount of simulations (1,000), we can return the percentage chance of the Spurs winning. This is the formula:

SUMPRODUCT counts the instances of the values in Column B of the ŌĆśSimulationsŌĆÖ worksheet (SpursŌĆÖ points) being greater than those in Column C (ClippersŌĆÖ points). Dividing by the number of trials gives a result of 28.70%. This means that in 287 trials the Spurs beat the Clippers.
Obviously the probability of the Clippers winning would be 1 - 28.70% = 71.30%. However, IŌĆÖll put in the SUMPRODUCT formula for some consistency.

To get the Intrinsic Value of an event, simply divide 1 by the eventŌĆÖs probability. Here, 1 / Spurs Win % = Fair Value .

Assuming the model is accurate, you could say that any sportsbook offering odds above $3.48 for the Spurs would be undervaluing them. As a result, in taking that bet you would expect a positive Return on Investment (ROI).
Total Points
The Total Points market is two way and is based on the number of points scored in the match. This includes Overtime if necessary, which the NBA Model simulates if the scores are tied after Regular Time. In this spreadsheet, weŌĆÖll use the SUMPRODUCT function to find the probability of the points in the Spurs vs Clippers going over/under a threshold of 220.5. IŌĆÖll find the Over probability first.
Using the SUMPRODUCT formula below, simply add the scores in Columns B & C in the Simulations worksheet (representing the Spurs and Clippers scores). If they are greater than the points threshold in cell B7, then the SUMPRODUCT function will count that trial. Divide the count by 1,000 to get the probability as a percentage.

To find the Under probability, simply change the greater than sign ( > ) to less than ( < ). The Intrinsic Value formula will remain the same (1 divided by the eventŌĆÖs probability).

The benefit of setting up the formula with references to cells rather than hard-coded numbers is that you can go and change the parameters for different games. For example, if I change cell B7 to a points threshold of 260.5, the probabilities for the Over/Under market will change accordingly.
Handicap Betting
The Handicap Betting market is when teams have points added or subtracted from their total. Normally the favourites will have points taken away from their total, so that the odds that they will cover this line will be around $1.90 (as set by the bookmakers). For example, these are the SportsBet Handicap Betting odds for the Celtics vs Magic game (where the Celtics are the favourites):

To get these odds from the simulations in the NBA Model, we can also use the SUMPRODUCT function. Firstly, we need to type in the advantage/disadvantage for the two teams. WeŌĆÖll find the probability of Spurs ŌĆ£covering the lineŌĆØ with a 10.5 point advantage. The SUMPRODUCT function will count a trial if the SpursŌĆÖ score, plus the 10.5 point advantage, is greater than the score of the Clippers in that simulation. Divide by 1,000 to get the percentage chance.

For the ClippersŌĆÖ probability, The SUMPRODUCT function will count a trial if the ClippersŌĆÖ score, plus the -10.5 point disadvantage, is greater than the score of the Spurs in that simulation.

Thanks for reading lads, if you enjoyed this I strongly suggest signing up as a member to the Patreon! YouŌĆÖll get access to the Excel LADZ NBA Model, so that these probabilities will automatically update for you every game and every day without any effort on your part.
Comments
Very good so proud of you
Tim's Kitchen
2023-11-24 20:32:24 +0000 UTC